Simula Research Laboratory /
Center for Resilient Networks and Applications /
NorNet
Homepage of Thomas Dreibholz /
NetPerfMeter Homepage
Simula Research Laboratory /
Center for Resilient Networks and Applications /
NorNet
Homepage of Thomas Dreibholz /
NetPerfMeter Homepage
New release: netperfmeter-2.0.9. This update only provides a fix for Linux QUIC usage.
New release: netperfmeter-2.0.8. This version provides improvements of the module loader script, including added FreeBSD support.
New release: netperfmeter-2.0.7. This update provides improvements for the OpenBSD support.
New release: netperfmeter-2.0.6. This version provides some build improvements, including builds for NetBSD, OpenBSD, and MacOS.
New release: netperfmeter-2.0.5. This version adds CMake options to turn the installation of examples on or off.
New release: netperfmeter-2.0.4. This release provides updated manpages and improved shell completions. Furthermore, the tools CreateSummary, CombineSummaries, as well as ExtractVectors have been updated.
New release: netperfmeter-2.0.3. This version provides some small fixes, code clean-ups, and manpage updates.
New release: netperfmeter-2.0.2. It provides some small clean-ups in the shell completion scripts.
New release: netperfmeter-2.0.1.
New major release: netperfmeter-2.0.0. Finally, after a long time, there is a new major release, bringing various improvements, including:
NetPerfMeter is a network performance meter for the TCP, MPTCP, SCTP, UDP, DCCP, and QUIC transport protocols over IPv4 and IPv6. It simultaneously transmits bidirectional flows to an endpoint and measures the resulting flow bandwidths and QoS. Flows can be saturated (i.e. “send as much as possible”) or non-saturated with frame rate and frame sizes (like a multimedia transmission). Non-saturated flows can be configured with constant or variable frame rate/frame size, i.e. to realise Constant Bit Rate (CBR) or Variable Bit Rate (VBR) traffic. For both, frame rate and frame size, it is not only possible to set constant values but to also to use random distributions. Furthermore, flows can be set up as on/off flows. Of course, the flow parameters can be configured individually per flow and flow direction. The measurement results can be recorded as scalar files (summary of the run) and vector files (time series). These files can be processed further, e.g. for detailed analysis and plotting of the results. The Wireshark network protocol analyser provides out-of-the-box support for analysing NetPerfMeter packet traffic.
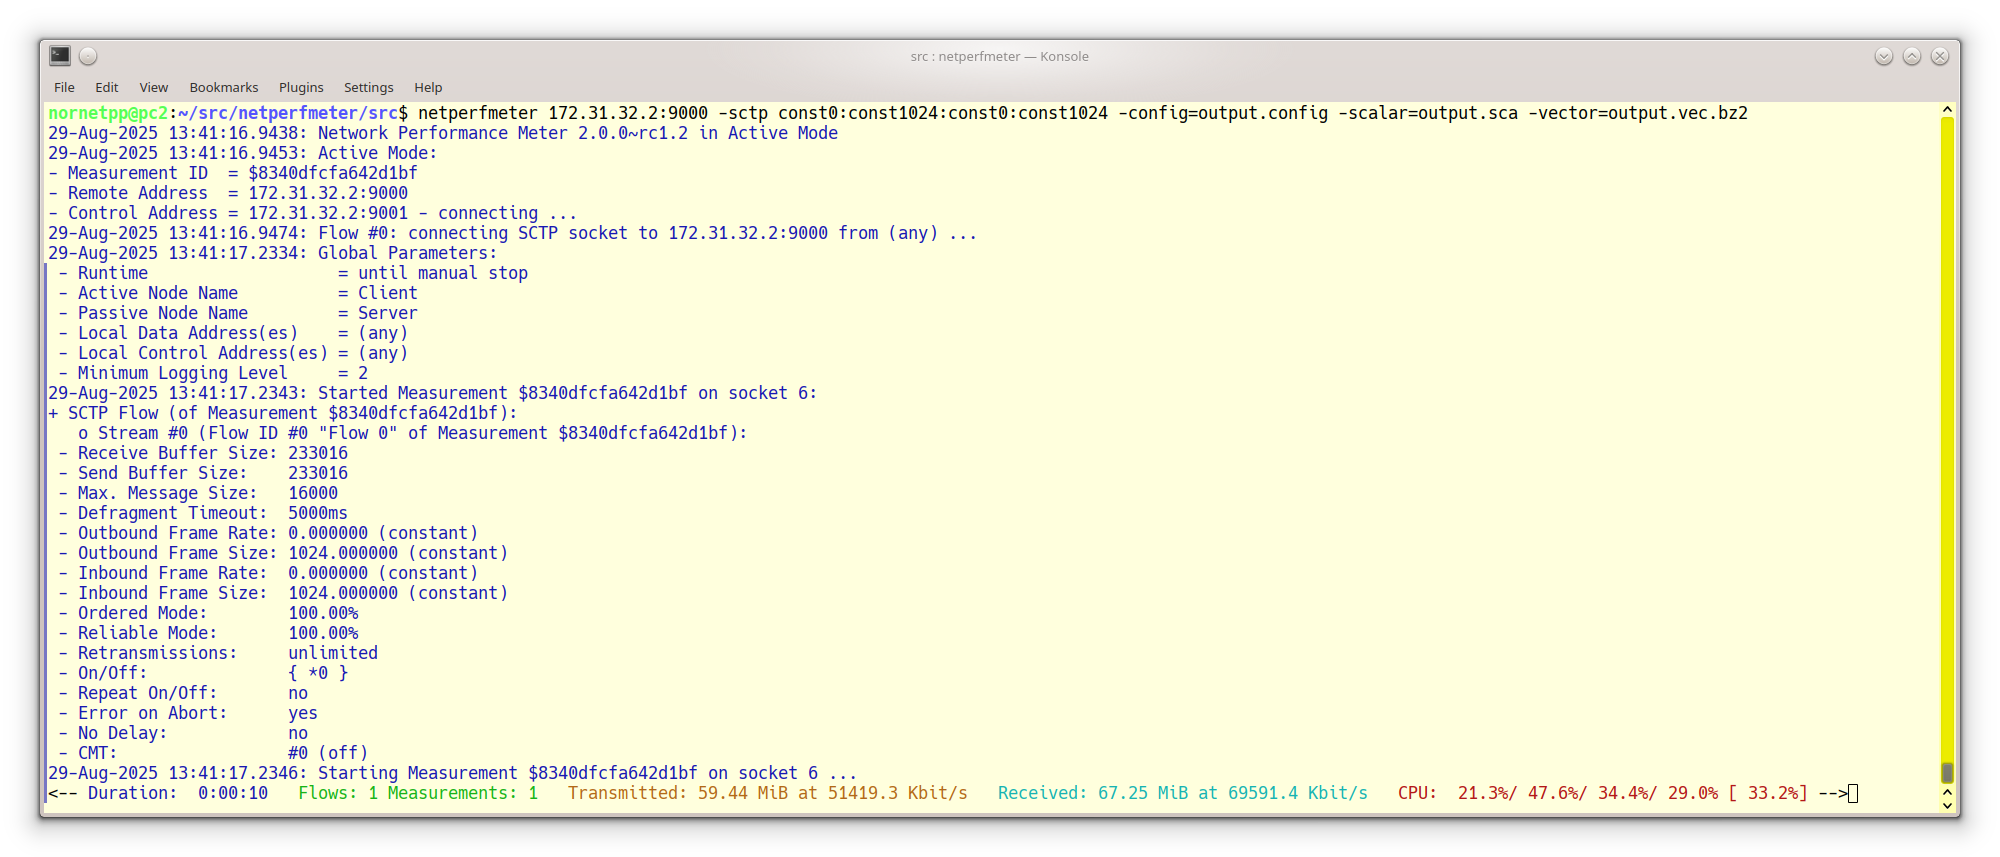
A NetPerfMeter Run with an SCTP Flow
The key goal of NetPerfMeter is to provide a tool for the performance comparison of multiple transport connections, which are further denoted as Flows. That is, it is possible to configure different flows between two systems using varying parameters, in order run a configured measurement, collect the obtained results and post-process them for statistical analyses. Particularly, all five relevant IETF Transport Layer protocols are supported:
Of course, this support includes the possibility to parametrise various protocol-specific options. Note, that the protocol support by NetPerfMeter depends on the underlying operating system. DCCP, MPTCP, as well as some SCTP extensions are not available on all platforms, yet.
Furthermore, each flow is able to apply its specific traffic behaviour:
Clearly, the NetPerfMeter application provides features similar to the NetPerfMeter simulation model in OMNeT++. It is therefore relatively easy – from the parametrisation perspective – to reproduce NetPerfMeter simulation scenarios in reality.

The Concept of a NetPerfMeter Measurement
Similar to the NetPerfMeter simulation model in OMNeT++, an application instance may either be in Active Mode (client side) or Passive Mode (server side). The figure above illustrates the concept of a NetPerfMeter measurement. The passive instance accepts incoming NetPerfMeter connections from the active instance. The active instance controls the passive instance, by using a control protocol denoted as NetPerfMeter Control Protocol (NPMP-CONTROL). That is, the passive instance may run as a daemon; no manual interaction by the user – e.g. to restart it before a new measurement run – is required. This feature is highly practical for a setup distributed over multiple Internet sites (e.g. like the NorNet Testbed) and allows for parameter studies consisting of many measurement runs.
The payload data between active and passive instances is transported using the NetPerfMeter Data Protocol (NPMP-DATA). The figure below shows the protocol stack of a NetPerfMeter node.

The NetPerfMeter Protocol Stack
The NPMP-DATA protocol transmits data as frames, with a given frame rate. In case of a saturated sender, the flow tries to send as many frames as possible (i.e. as allowed by the underlying transport and its flow and congestion control). Otherwise, the configured frame rate is used (e.g. 25 frames/s as for typical video transmissions). NPMP-DATA breaks down frames into messages, to make sure that large frames can be transported over the underlying transport protocol. The maximum message size can be configured. Frames larger than the message size limit are split into multiple messages before sending them. On the receiving side, the messages are combined back into frames. The underlying transport protocol handles the messages as its payload.
The following figure presents the message sequence of a NetPerfMeter measurement run:

A Measurement Run with NetPerfMeter
Note that the Wireshark network protocol analyser provides out-of-the-box support for NetPerfMeter. That is, it is able to dissect and further analyse NPMP-CONTROL and NPMP-DATA packets using all supported Transport Layer protocols.
A new measurement run setup is initiated by the active NetPerfMeter instance by establishing an NPMP-CONTROL association to the passive instance first. The NPMP-CONTROL association by default uses SCTP for transport. If SCTP is not possible in the underlying networks (e.g. due to firewalling restrictions), it is optionally possible to use TCP for the NPMP-CONTROL association instead. Then, the configured NPMP-DATA connections are established by their configured Transport Layer protocols. For the connection-less UDP, the message transfer is just started. The passive NetPerfMeter instance is informed about the identification and parameters of each new flow by using NPMP-CONTROL Add Flow messages. On startup of the NPMP-DATA flow, an NPMP-DATA Identify message allows the mapping of a newly incoming connection to a configured flow by the passive instance. It acknowledges each newly set up flow by an NPMP-CONTROL Acknowledge message. After setting up all flows, the scenario is ready to start the measurement run.
The actual measurement run is initiated from the active NetPerfMeter instance using an NPMP-CONTROL Start Measurement message, which is also acknowledged by an NPMP-CONTROL Acknowledge message. Then, both instances start running the configured scenario by transmitting NPMP-DATA Data messages over their configured flows.
During the measurement run, incoming and outgoing flow bandwidths may be recorded as vectors – i.e. time series – at both instances, since NPMP-DATA Data traffic may be bidirectional. Furthermore, the CPU utilisations – separately for each CPU and CPU core – are also tracked. This allows to identify performance bottlenecks, which is particularly useful when debugging and comparing transport protocol implementation performance. Furthermore, the one-way delay of messages can be recorded. Of course, in order to use this feature, the clocks of both nodes need to be appropriately synchronised, e.g. by using the Network Time Protocol (NTP).
The end of a measurement run is initiated – from the active NetPerfMeter instance – by using an NPMP-CONTROL Stop Measurement message. Again, it is acknowledged by an NPMP-CONTROL Acknowledge message. At the end of the measurement, average bandwidth and one-way delay of each flow and stream are recorded as scalars (i.e. single values). They may provide an overview of the long-term system performance.
After stopping the measurement, the passive NetPerfMeter instance sends its global vector and scalar results (i.e. over all flows) to the active instance, by using one or more NPMP-CONTROL Results messages. Then, the active NetPerfMeter instance sequentially removes the flows by using NPMP-CONTROL Remove Flow messages, which are acknowledged by NPMP-CONTROL Acknowledge messages. On flow removal, the passive instance sends its per-flow results for the corresponding flow, again by using NPMP-CONTROL Results messages.
The active instance, as well, archives its local vector and scalar results data and stores them – together with the results received from its peer – locally. All result data is compressed by using BZip2 compression (see bzip2), which may save a significant amount of bandwidth (of course, the passive node compresses the data before transfer) and disk space.
By using shell scripts, it is possible to apply NetPerfMeter for parameter studies, i.e. to create a set of runs for each input parameter combination. For example, a script could iterate over a send buffer size σ from 64 KiB to 192 KiB in steps of 64 KiB as well as a path bandwidth ρ from 10 Mbit/s to 100 Mbit/s in steps of 10 Mbit/s and perform 5 measurement runs for each parameter combination.
When all measurement runs have eventually been processed, the results have to be visualised for analysis and interpretation. The NetPerfMeter package provides support to visualise the scalar results, which are distributed over the scalar files written by measurement runs. Therefore, the first step necessary is to bring the data from the various scalar files into an appropriate form for further post-processing. This step is denoted as Summarisation; an introduction is also provided in “SimProcTC – The Design and Realization of a Powerful Tool-Chain for OMNeT++ Simulations”.
The summarisation task is performed by the tool createsummary. An external program – instead of just using GNU R itself to perform this step – is used due to the requirements on memory and CPU power. createsummary iterates over all scalar files of a measurement M. Each file is read – with on-the-fly BZip2-decompression – and each scalar value as well as the configuration m∈M having led to this value – are stored in memory. Depending on the number of scalars, the required storage space may have a size of multiple GiB.
Since usually not all scalars of a measurement are required for analysis (e.g. for an SCTP measurement, it may be unnecessary to include unrelated statistics), a list of scalar name prefixes to be excluded from summarisation can be provided to createsummary, in form of the so-called Summary Skip List. This feature may significantly reduce the memory and disk space requirements of the summarisation step. Since the skipped scalars still remain stored in the scalar files themselves, it is possible to simply re-run createsummary with updated summary skip list later, in order to also include them.
Having all relevant scalars stored in memory, a data file – which can be processed by GNU R, LibreOffice or other programs – is written for each scalar. The data file is simply a table in text form, containing the column names on the first line. Each following line contains the data, with line number and an entry for each column (all separated by spaces); an example is provided in Listing 3 of “SimProcTC – The Design and Realization of a Powerful Tool-Chain for OMNeT++ Simulations”. That is, each line consists of the settings of all parameters and the resulting scalar value. The data files are also BZip2-compressed on the fly, in order to reduce the storage space requirements.
NetPerfMeter by default uses the SCTP protocol for control communication (which can be changed by the -control-over-tcp option, see later). It may be useful to allow loading the SCTP kernel module first, if not already enabled. The following code blocks show how to enable it permanently.
echo "sctp" | sudo tee /etc/modules-load.d/sctp.conf
if [ -e /etc/modprobe.d/sctp-blacklist.conf ] ; then
   sudo sed -e 's/^blacklist sctp/# blacklist sctp/g' -i /etc/modprobe.d/sctp-blacklist.conf
fi
sudo modprobe sctp
lsmod | grep sctpecho 'sctp_load="YES"' | sudo tee --append /boot/loader.conf
sudo kldload sctp
kldstat | grep sctpNetBSD requires a custom kernel, with SCTP enabled.
Unfortunately, OpenBSD does not support SCTP. Therefore, NetPerfMeter on OpenBSD uses TCP for control communication by default.
NetPerfMeter provides a helper script to load, unload, and show the available congestion control modules:
Show status:
netperfmeter-module-loader statusLoad modules:
sudo netperfmeter-module-loader startUnload modules:
sudo netperfmeter-module-loader stopNetPerfMeter’s usage of protocols and ports depends on the base port parameter of the passive instance (server).
| Protocol | NPMP-DATA | NPMP-CONTROL |
|---|---|---|
| TCP | BASE | BASE + 1 |
| MPTCP | BASE - 1 | — |
| UDP | BASE | BASE + 1 |
| SCTP | BASE | BASE |
| DCCP | BASE | — |
| QUIC (UDP) | BASE - 1 | — |
Notes:
For the following examples, the base port is usually set to 9000.
Run a passive instance (i.e. server side), using base port 9000:
netperfmeter 9000NetPerfMeter supports SCTP and TCP for the NPMP-CONTROL control communication. By default, the passive side accepts incoming control connections on both protocols. In case of unavailability of SCTP, e.g. the SCTP kernel module is not loaded, a warning is printed. Obviously, control communication in this case will only be possible via TCP.
Run a passive instance (i.e. server side), using base port 9000, and allowing NPMP-CONTROL control communication only over TCP (this disables checking for SCTP, and the warning if unavailable):
netperfmeter 9000 -no-control-over-sctp
Note that the active instance (i.e. client side) can only connect via TCP in this case, and it needs to be instructed (as explained below, also using the -control-over-tcp option) to do so!
A NetPerfMeter service unit for SystemD is available:
In addition, a service unit for loading and allowing all available congestion control modules is provided as well: netperfmeter-module-loader.service. The module loader service is optional, i.e. without it, only manually-enabled congestion control modules will be available.
Enable and start:
# Optional:
sudo systemctl enable netperfmeter-module-loader.service
sudo systemctl start netperfmeter-module-loader.service

sudo systemctl enable netperfmeter.service
sudo systemctl start netperfmeter.service
sudo systemctl status netperfmeter.service
Stop and disable:
sudo systemctl stop netperfmeter.service
sudo systemctl disable netperfmeter.service

sudo systemctl stop netperfmeter-module-loader.service
sudo systemctl disable netperfmeter-module-loader.service
A NetPerfMeter service script for RC is available: netperfmeter.rc.
In addition, an RC service script for loading and allowing all available congestion control modules is provided as well: netperfmeter-module-loader.rc. The module loader service is optional, i.e. without it, only manually-enabled congestion control modules will be available.
In /etc/rc.conf:
# Optional:
netperfmeter_module_loader_enable="YES"

netperfmeter_enable="YES"
netperfmeter_port="9000"
netperfmeter_loglevel="2"
netperfmeter_options="-control-over-tcp"
Enable and start:
sudo service netperfmeter-module-loader enable
sudo service netperfmeter-module-loader start

sudo service netperfmeter enable
sudo service netperfmeter start
Stop and disable:
sudo service netperfmeter stop
sudo service netperfmeter disable

sudo service netperfmeter-module-loader stop
sudo service netperfmeter-module-loader disableRun an active instance (i.e. client side), with a saturated bidirectional TCP flow:
netperfmeter $SERVER:9000 -tcp const0:const1400:const0:const1400
Replace $SERVER by the IP address or hostname of the passive instance, or set an environment variable SERVER=<address>!
The flow parameter specifies a saturated flow (frame rate 0 – send a much as possible) with a constant frame size of 1400 B. The first block specifies the direction from active (client) to passive (server) instance, the second block specifies the direction from passive (server) to active (client) instance.
⚠️Important: By default, SCTP transport is used for the NPMP-CONTROL control communication. In certain setups, this can cause problems. In this case, it may be necessary to use control over TCP (or MPTCP) instead (to be shown in the next example, using the -control-over-tcp option):
In case of connectivity problems try control over TCP as shown next.
Run an active instance (i.e. client side), with a saturated bidirectional TCP flow, using NPMP-CONTROL control communication over TCP.
netperfmeter $SERVER:9000 -control-over-tcp -tcp const0:const1400:const0:const1400
Or, using the short option -y:
netperfmeter $SERVER:9000 -y -t const0:const1400:const0:const1400Run an active instance (i.e. client side), with a saturated bidirectional TCP flow, using NPMP-CONTROL control communication over SCTP (this is the default):
netperfmeter $SERVER:9000 -tcp const0:const1400:const0:const1400Run an active instance (i.e. client side), with a download-only TCP flow (server to client):
netperfmeter $SERVER:9000 -tcp const0:const0:const0:const1400Setting both, frame rate and frame size to 0, means to send nothing in the corresponding direction.
Run an active instance (i.e. client side), with a upload-only TCP flow (client to server):
netperfmeter $SERVER:9000 -tcp const0:const1400:const0:const0Run an active instance (i.e. client side), with bidirectional UDP flow:
netperfmeter $SERVER:9000 -udp const2:const200:const25:const5000Setting both, frame rate and frame size to constant 0, which means to send nothing in the corresponding direction.
Note: UDP does not have flow and congestion control. A saturated UDP flow is therefore not possible!
Run an active instance (i.e. client side), with bidirectional DCCP flow:
netperfmeter $SERVER:9000 -dccp const10:const128:const25:const1200Note: DCCP is only available when provided by the operating system kernel, and DCCP supports need to be compiled into NetPerfMeter.
Run an active instance (i.e. client side), with 2 bidirectional SCTP flows over a single SCTP association (i.e. 2 streams):
Stream 0:
Stream 1:
netperfmeter $SERVER:9000 -sctp const2:const200:const25:const5000 const10:const128:const25:const1200Run an active instance (i.e. client side), with a saturated bidirectional MPTCP flow:
netperfmeter $SERVER:9000 -mptcp const0:const1400:const0:const1400Notes:
QUIC uses built-in security based on Transport Layer Security (TLS). To use QUIC, it is therefore necessary to properly set up TLS first. Furthermore, NetPerfMeter has to be built with QUIC support. Currently, it supports Linux Kernel QUIC.
Install Linux Kernel QUIC and load the QUIC kernel module. Also see the helper script install-linux-quic.
Build NetPerfMeter from sources (see Build from Sources). Make sure that Linux Kernel QUIC is detected during the CMake configuration!
Generate a key and corresponding X.509 TLS certificate for the server. For details, see e.g. the various documentations and tutorials for OpenSSL, Gnu TLS, or NSS. Also, the directory src/quic-setup provides some example scripts. The following commands use these scripts to generate a test cerfitication authority TestCA, signing a server certificate for server server.domain.example (with the local machine’s IP addresses in SubjectAltName):
cd src/quic-setup
./generate-test-certificates TestCA --server --san LOCAL server.domain.example
These commands generate the following files:
TestCA/TestLevel1/certs/TestLevel1.crt: The top-level CA certificate.TestCA/server.domain.example/server.domain.example.key: The server key.TestCA/server.domain.example/server.domain.example.crt: The corresponding server certificate.The server certificate can be verified using the CA certificate:
./check-certificate \
   TestCA/TestLevel1/certs/TestLevel1.crt \
   TestCA/server.domain.example/server.domain.example.crt
The X.509-Tools provide further helpful utilities to handle X.509 certificates.
Run a passive instance (i.e. server side), using base port 9000, and specifying server key, server certificate, as well as root CA certificate:
netperfmeter 9000 \
   -tls-key  $DIRECTORY/TestCA/server.domain.example/server.domain.example.key \
   -tls-cert $DIRECTORY/TestCA/server.domain.example/server.domain.example.crt \
   -tls-ca   $DIRECTORY/TestCA/TestLevel1/certs/TestLevel1.crt
Run an active instance (i.e. client side), with bidirectional QUIC flow, and specifying the TLS hostname of the server for certificate validation:
netperfmeter $SERVER:9000 \
   -tls-hostname server.domain.example \
   -tls-ca $DIRECTORY/TestCA/TestLevel1/certs/TestLevel1.crt \
   -quic const10:const128:const25:const1200
Make sure that the server name matches the with the information in the server certificate provided by the passive instance. TLS is verifying it, and the TLS handshake will fail (as intended) if it does not match!
See Wireshark for details on how to examine the NetPerfMeter QUIC traffic with Wireshark!
NetPerfMeter supports randomised frame rate and frame size, to create variable bitrate (VBR) flows. The following distributions are currently available:
A configured distribution is used to determine:
Some examples:
A unidirectional TCP flow with constant 2 frames;/s and uniformly distributed frame sizes between 100 bytes and 20000 bytes:
netperfmeter $SERVER:9000 -tcp const2:uniform100,20000A bidirectional SCTP flow with constant 2 frames;/s and uniformly distributed frame sizes between 100 bytes and 1000 bytes outgoing, and an uniform frame rate from [0.2, 10.5) frames/s and frame sizes with an average of 1000 bytes using exponential distribution incoming:
netperfmeter $SERVER:9000 -sctp const2:uniform100,1000:uniform0.2,10.5:exp1000An incoming UDP flow, with constant 25 frames/s of constant 1000 bytes, on-time and off-time pareto-distributed with location 0.166667 and shape 1.5, repeating in a loop:
netperfmeter $SERVER:9000 -udp const0:const0:const25:const1000:onoff=+pareto0.166667,1.5,+pareto0.166667,1.5,repeat netperfmeter $SERVER:9000 \
-runtime=60 \
-count=10 \
-tcp const10:const4096:const10:const4906Run an active instance (i.e. client side), with 7 flows, stopping the measurement after 60 s:
netperfmeter $SERVER:9000 \
   -runtime=60 \
   -tcp  const10:const4096:const10:const4906 \
   -udp  const10:const1024:const10:const1024 \
   -sctp \
      const1:const512:const5:const512 \
      const2:const512:const4:const512 \
      const3:const512:const3:const512 \
      const4:const512:const2:const512 \
      const5:const512:const1:const512
Run an active instance (i.e. client side), with 9 flows, stopping the measurement after 60 s:
The example above, but recording measurement data and flow information into files, including descriptions for active/passive instance and the flows:
multi.config;netperfmeter $SERVER:9000 \
-runtime=60 \
-config=multi.config \
-vector=multi.vec \
-scalar=multi.sca \
-activenodename "Active Instance" \
-passivenodename "Passive Instance" \
-tcp const10:const4096:const10:const4906:description="TCP" \
-mptcp const10:const4096:const10:const4906:description="MPTCP" \
-udp const10:const1024:const10:const1024:description="UDP" \
-dccp const10:const1024:const10:const1024:description="DCCP" \
-sctp \
const1:const512:const5:const512:description="SCTP Stream 0" \
const2:const512:const4:const512:description="SCTP Stream 1" \
const3:const512:const3:const512:description="SCTP Stream 2" \
const4:const512:const2:const512:description="SCTP Stream 3" \
const5:const512:const1:const512:description="SCTP Stream 4"Notes:
An example output of the multi-flow example above, measurered in a multi-homed testbed setup, provides the following output:
The configuration file multi.config. It contains the flows and their parameters. It can be used to further process the scalar and vector output. Particularly, it is also used by plot-netperfmeter-results to plot an overview of the recorded vectors.
Scalar files (i.e. summaries of the single measurement run) from active side (multi-active.sca) and passive side (multi-passive.sca). The scalar file format is the same as used by OMNeT++.
Vector files (i.e. time series) for each flow, from active and passive side:
Flow 0 (TCP flow): active-00000000-0000.vec, passive-00000000-0000.vec.
Flow 1 (MPTCP flow): active-00000001-0000.vec, passive-00000001-0000.vec.
Flow 2 (UDP flow): active-00000002-0000.vec, passive-00000002-0000.vec.
Flow 3 (DCCP flow): active-00000003-0000.vec, passive-00000003-0000.vec.
Flow 4 (SCTP flow for SCTP stream 0): active-00000004-0000.vec, passive-00000004-0000.vec.
Flow 5 (SCTP flow for SCTP stream 1): active-00000005-0001.vec, passive-00000005-0001.vec.
Flow 6 (SCTP flow for SCTP stream 2): active-00000006-0002.vec, passive-00000006-0002.vec.
Flow 7 (SCTP flow for SCTP stream 3): active-00000007-0003.vec, passive-00000007-0003.vec.
Flow 8 (SCTP flow for SCTP stream 4): active-00000008-0004.vec, passive-00000008-0004.vec.
The vector file format is a table, which can be read with CSV import of tools like GNU R, LibreOffice, etc.
Take a look into the manual page of NetPerfMeter for further information and options:
man netperfmeterObtain the NetPerfMeter version:
netperfmeter -versionNote: NetPerfMeter ≥2.0 is required!
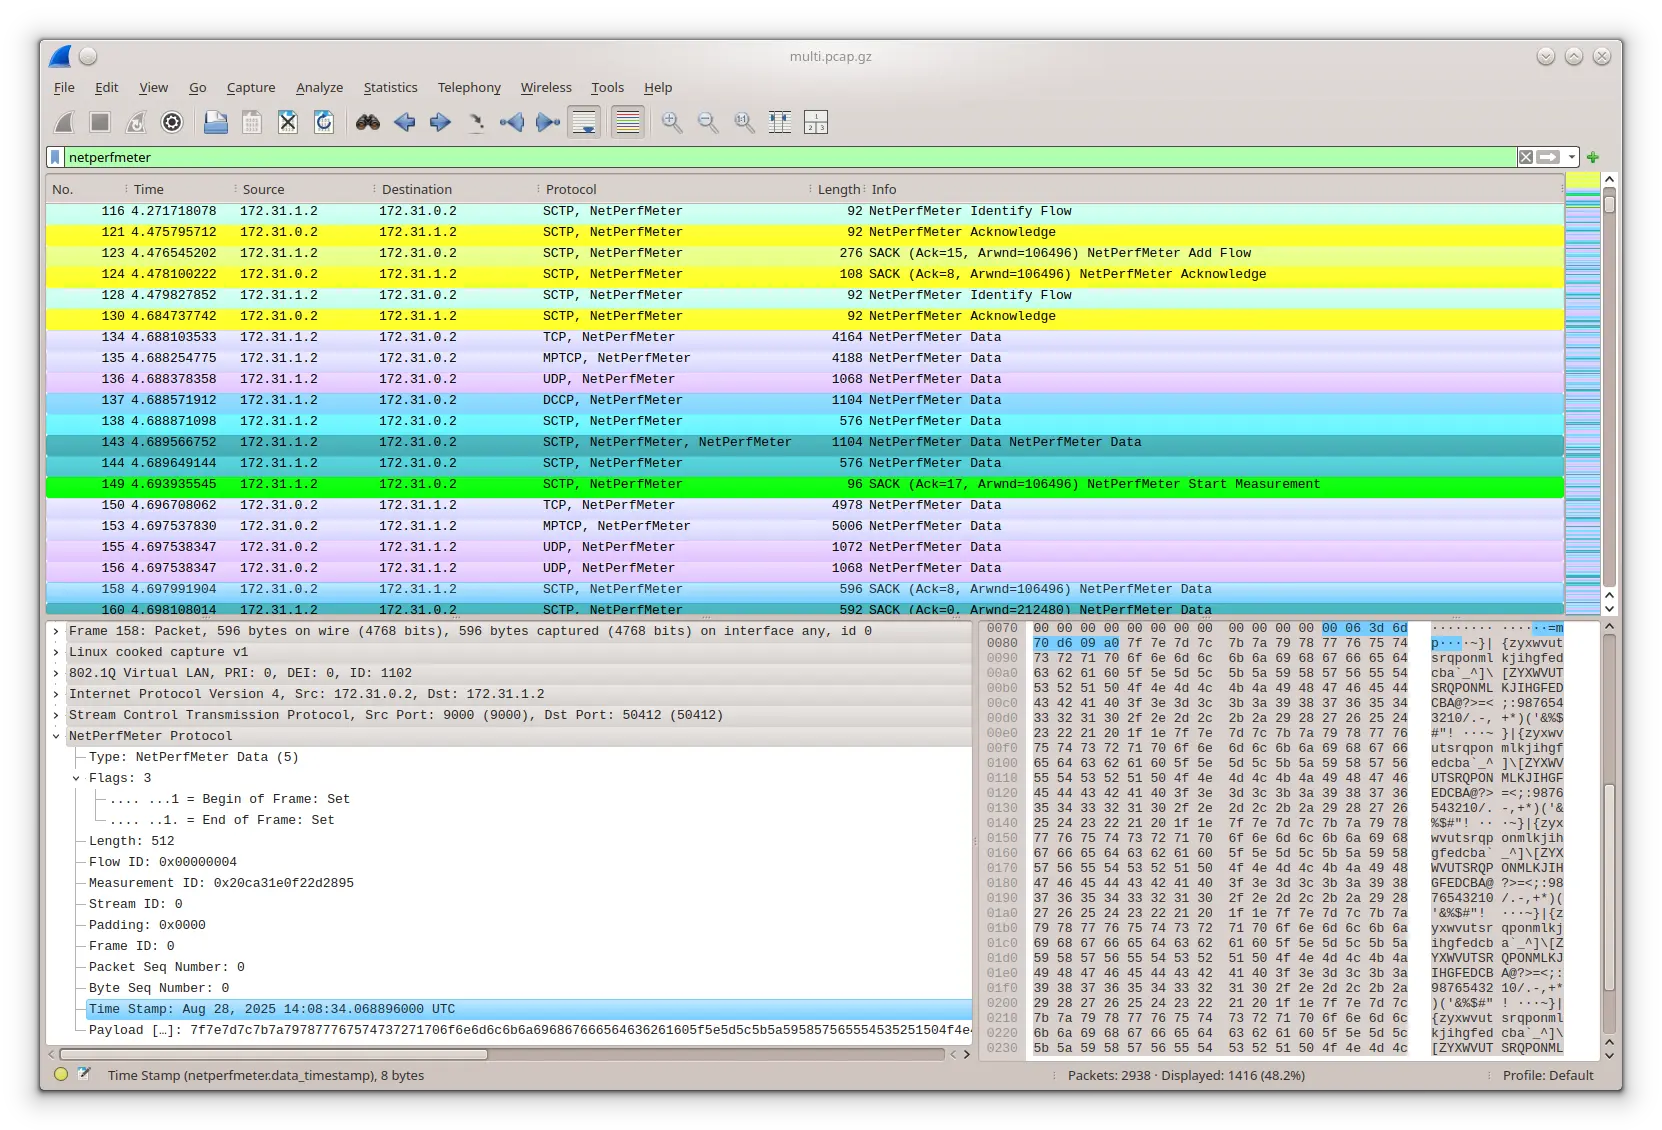
A Wireshark Run with NetPerfMeter Traffic from multi.pcap.gz
Run T-Shark (the command-line version of the Wireshark network protocol analyser) to record a PCAP trace:
sudo tshark -i any -n -w output.pcap \
   -f '(sctp and portrange 9000-9001) or (tcp and portrange 8999-9001) or (udp and portrange 8999-9001) or (ip proto 33)'
Notes:
Filter parameters for protocols and ports can ensure to record only the relevant NetPerfMeter traffic.
In case of using port 9000 for NetPerfMeter, record:
ip proto 33; PCAP filtering does not support DCCP).
Run Wireshark network protocol analyser to display the packet flow of the multi-flows example above in PCAP file multi.pcap.gz:
wireshark multi.pcap.gzNotes:
Wireshark provides out-of-the-box support for NetPerfMeter, i.e. a dissector is included in all recent Wireshark packages.
To decode NetPerfMeter packets, particularly over TCP and UDP, it may be necessary to configure “Decode As” rules. While SCTP (by Payload Protocol Identifiers 36 and 37), DCCP (by Service Code “npmp”) and QUIC (by ALPNs “netperfmeter/control” and “netperfmeter/data”) allow for unambiguous identification of the NetPerfMeter payload, Wireshark has to rely on heuristics for TCP and UDP. They may fail to recognise the NetPerfMeter payload. The “Decode As” rules configuration in the “Analyze” menu allows to set explicit rules for TCP ports (e.g. 8999, 9000, and 9001) and UDP port numbers (e.g. 8999 and 9000) for decoding matching packets as NetPerfMeter payload.
To simplify SCTP packet filtering, it is recommended to activate “Enable association indexing” in the SCTP protocol settings (Preferences → Protocols/SCTP → Enable association indexing).
Coloring rules, filters and “Decode As” rules can be found in the directory netperfmeter/src/wireshark. Simply copy colorfilters, dfilters, decode_as_entries, and optionally preferences to $HOME/.wireshark.
To decode TLS-encrypted QUIC traffic (or other TLS-encrypted traffic), it is necessary to let QUIC/TLS log the session keys.
Prepare a directory and file for key export:
mkdir -m700 -p /home/$USER/keylog
touch /home/$USER/keylog/sslkeylog.log
chmod 600 /home/$USER/keylog/sslkeylog.log
Configure Wireshark:
/home/$USER/keylog/sslkeylog.log.8999-9001 (or your used ports).
When running NetPerfMeter, set the environment variable SSLKEYLOGFILE to your session key logfile:
SSLKEYLOGFILE=/home/$USER/keylog/sslkeylog.log netperfmeter ...When recording a NetPerfMeter QUIC communication, make sure to also include the QUIC connection handshake!
Goal of many NetPerfMeter measurements is likely to perform larger-scale measurements, with multiple NetPerfMeter runs for every combination of NetPerfMeter as well as non-NetPerfMeter parameters.
Example “experiment1”:
The corresponding measurement can be implemented as script (in arbitrary language, e.g. as a simple shell script), basically implementing something like this:
#!/bin/sh -eu

NAME="experiment1"
RUNTIME=60
CONTROL="--control-over-tcp"   # E.g.: --control-over-tcp --local=... --controllocal=...
DESTINATIONS="10.10.10.10 172.20.30.40 fd91:b3aa:b9c:beef::10 fdd8:c818:a429:cafe:40"
FLOWS="const0:const1024:const0:const1024"
PROTOCOLS="tcp sctp"
OPTION1="value1"
OPTION2="test1"

# ------ Prepare results directory --------------------------------------------------------
mkdir -p "$NAME"
cd "$NAME"

for destination in $DESTINATIONS ; do
   for flow in $FLOWS ; do
      for protocol in $PROTOCOLS ; do
         for option1 in $OPTION1 ; do
            for option2 in $OPTION2 ; do

               # ------ Prepare a unique directory for the results ------------------------
               now="$(date -u -Iseconds)"   # <- Unique name by using date
               run="$now:$destination-$flow-$protocol-$option1-$option2"
               directory="run-$(echo "$run" | sha1sum | cut -d' ' -f1)"
               mkdir -p "$directory"
               timestamp="$(getabstime)"   # Current time as Unix timestamp in microseconds

               # Do something, to configure non-NetPerfMeter options
               # something-to-configure-option1 "$option1"
               # something-to-configure-option2 "$option2"
               # ...

               # ------ Run NetPerfMeter --------------------------------------------------
               (
                  cd "$directory"
                  # *******************************************************************
                  # NOTE: Add option `--vector "run.vec.bz2"` only when necessary!
                  # Vectors may use a lot of storage capacity for high-bandwidth flows!
                  # *******************************************************************
                  netperfmeter "[$destination]:9000" \
                     --config "run.config"  \
                     --scalar "run.sca.bz2" \
                     --vector "run.vec.bz2" \
                     --runtime "$RUNTIME"   \
                     ${CONTROL}             \
                     "--$protocol" const0:const1024:const0:const1024
               )

            done
         done
      done
   done
done
Notes:
date -u -Iseconds) is used to create a unique identifier for each run.run) may contain special characters, e.g. spaces and slashes, etc. To create a usable and reasonably short directory name, it is SHA-1-hashed, to assemble a directoryName in directory.--vector ... to also write vector files. However, in larger-scale or high-bandwidth measurements, vectors are often unnecessary, and their output can be very large. Therefore, only apply it if necessary!
The result of the script execution is a directory experiment1, with one subdirectory run-<HASH> for each NetPerfMeter run. Each of these subdirectories will contain the scalar files run-active.sca.bz2 (active-side results) and run-passive.sca.bz2 (passive-side results), with all written scalars.
Clearly, the goal is to create a summary for each scalar, i.e. a table with columns for each parameter setting and the resulting scalar value, i.e. for the scalar passive.flow-ReceivedBitRate:
| Timestamp | Destination | Protocol | Flow | Option1 | Option2 | Directory | passive.flow-ReceivedBitRate |
|---|---|---|---|---|---|---|---|
| 1765557402276097 | 10.10.10.10 | tcp | … | value1 | test1 | run-<HASH1> | 12345678 |
| 1765557493682363 | 10.10.10.10 | tcp | … | value1 | test2 | run-<HASH2> | 11111111 |
| 1765557567874323 | … | … | … | … | … | run-<HASH…> | … |
| 1765557789993130 | fdd8:c818:a429:cafe:40 | sctp | … | value3 | test3 | run-<HASH_LAST> | 11223344 |
The summarisation task can be realised by the tool CreateSummary. It generates the output tables (BZip2-compressed CSV format, using TAB as delimiter) from all the scalar files of the measurement. For this summarisation, it needs information about:
In the example above, this information needs to be added by preparing an input file results.summary, and then process this input by CreateSummary:
...

# ------ Prepare results directory --------------------------------------------------------
mkdir -p "$NAME"
cd "$NAME"
if [ ! -e results.summary ] ; then
   echo "--varnames=Timestamp Destination Protocol Flow Option1 Option2 Directory" >results.summary
fi

for destination in $DESTINATIONS ; do
   ...
            ...

               # ------ Run NetPerfMeter --------------------------------------------------
               ...

               # ------ Append run to results.summary -------------------------------------
               (
                  echo "--values=$timestamp $destination $protocol $flow $option1 $option2 $directory"
                  echo "--input=$directory/run-active.sca.bz2"
                  echo "--values=$timestamp $destination $protocol $flow $option1 $option2 $directory"
                  echo "--input=$directory/run-passive.sca.bz2"
               ) >>results.summary

            ...
   ...
done

# ------ Run CreateSummary ----------------------------------------------------------------
createsummary --batch <results.summary
The full script is available in: run-experiment1.
Notes:
The result of the script execution is a BZip2-compressed CSV table for each scalar, e.g. active.flow-ReceivedBitRate.data.bz2 and passive.flow-ReceivedBitRate.data.bz2 containing the received bit rates of active and passive side. These files can be loaded into arbitrary tools handling CSV files. If necessary TAB needs to be specified as delimiter. For example, in GNU R:
library("data.table")

results <- fread("experiment1/active.flow-ReceivedBitRate.data.bz2")

print(summary(results))                                    # Show data summary
print(colnames(results))                                   # Show table columns
print(results$"active.flow-ReceivedBitRate" / 1000000.0) # Received bit rate in Mbit/sIn some cases, it may be necessary to combine summary tables written by CreateSummary. For example, measurements have been from hosts host1.example and host2.example, now having collected data from both hosts. For analysis, the results in separate files (i.e. tables) for each host can be combined into a single file, with a new table column “Host” containing the measurement host:
(
  echo '--values="host1.example"'
  echo '--input=host1/experiment1/active.flow-ReceivedBitRate.data.bz2'
  echo '--values="host2.example"'
  echo '--input=host2/experiment1/active.flow-ReceivedBitRate.data.bz2'
) | combinesummaries combined-active.flow-ReceivedBitRate.data.bz2 "Host"
Then, after loading the resulting combined file combined-active.flow-ReceivedBitRate.data.bz2 into an analysis tool like GNU R, the information about the host is in the added table column “Host”.
An example for processing the generated scalar data is provided by the script plot-experiment:
./plot-experiment experiment1/active.flow-ReceivedBitRate.data.bz2
./plot-experiment combined-active.flow-ReceivedBitRate.data.bz2
...
Note that this script is only a very basic example.
plot-netperfmeter-results (internally calling plot-netperfmeter-results.R for plotting) can be used to get an overview of the vector outputs for a certain run.
Identify the run of interest.
In the corresponding run-<HASH> directory:
plot-netperfmeter-results run.config
The resulting PDF plot file will be run.pdf.
Please use the issue tracker at https://github.com/dreibh/netperfmeter/issues to report bugs and issues!
For ready-to-install Ubuntu Linux packages of NetPerfMeter, see Launchpad PPA for Thomas Dreibholz!
sudo apt-add-repository -sy ppa:dreibh/ppa
sudo apt-get update
sudo apt-get install netperfmeter-allFor ready-to-install Fedora Linux packages of NetPerfMeter, see COPR PPA for Thomas Dreibholz!
sudo dnf copr enable -y dreibh/ppa
sudo dnf install netperfmeter-allFor ready-to-install FreeBSD packages of NetPerfMeter, it is included in the ports collection, see FreeBSD ports tree index of benchmarks/netperfmeter/!
sudo pkg install netperfmeterAlternatively, to compile it from the ports sources:
cd /usr/ports/benchmarks/netperfmeter
make
sudo make installNetPerfMeter is released under the GNU General Public Licence (GPL).
Please use the issue tracker at https://github.com/dreibh/netperfmeter/issues to report bugs and issues!
The Git repository of the NetPerfMeter sources can be found at https://github.com/dreibh/netperfmeter:
git clone https://github.com/dreibh/netperfmeter
cd netperfmeter
sudo ci/get-dependencies --install
cmake .
make
Optionally, for installation to the standard paths (usually under /usr/local):
sudo make install
Note: The script ci/get-dependencies automatically installs the build dependencies under Debian/Ubuntu Linux, Fedora Linux, and FreeBSD. For manual handling of the build dependencies, see the packaging configuration in debian/control (Debian/Ubuntu Linux), netperfmeter.spec (Fedora Linux), and Makefile FreeBSD.
Contributions:
Issue tracker: https://github.com/dreibh/netperfmeter/issues. Please submit bug reports, issues, questions, etc. in the issue tracker!
Pull Requests for NetPerfMeter: https://github.com/dreibh/netperfmeter/pulls. Your contributions to NetPerfMeter are always welcome!
CI build tests of NetPerfMeter: https://github.com/dreibh/netperfmeter/actions.
Coverity Scan analysis of NetPerfMeter: https://scan.coverity.com/projects/dreibh-netperfmeter.
The tarball has been signed with my GnuPG key 21412672518D8B2D1862EFEF5CD5D12AA0877B49. Its authenticity and integrity can be verified by:
gpg --keyserver hkp://keyserver.ubuntu.com --recv-keys 21412672518D8B2D1862EFEF5CD5D12AA0877B49
gpg --verify netperfmeter-<VERSION>.tar.xz.asc netperfmeter-<VERSION>.tar.xz
The tarballs have been signed with my GnuPG key 21412672518D8B2D1862EFEF5CD5D12AA0877B49. Its authenticity and integrity can be verified by:
gpg --keyserver hkp://keyserver.ubuntu.com --recv-keys 21412672518D8B2D1862EFEF5CD5D12AA0877B49
gpg --verify netperfmeter-<VERSION>.tar.xz.asc netperfmeter-<VERSION>.tar.xz
NetPerfMeter BibTeX entries can be found in netperfmeter.bib!
Dreibholz, Thomas; Becke, Martin; Adhari, Hakim and Rathgeb, Erwin Paul: «Evaluation of A New Multipath Congestion Control Scheme using the NetPerfMeter Tool-Chain» (PDF, 360 KiB, 6 pages, 🇬🇧), in Proceedings of the 19th IEEE International Conference on Software, Telecommunications and Computer Networks (SoftCOM), pp. 1–6, ISBN 978-953-290-027-9, Hvar, Dalmacija/Croatia, September 16, 2011.
Dreibholz, Thomas: «Evaluation and Optimisation of Multi-Path Transport using the Stream Control Transmission Protocol» (PDF, 36779 KiB, 264 pages, 🇬🇧), Habilitation Treatise, University of Duisburg-Essen, Faculty of Economics, Institute for Computer Science and Business Information Systems, URN urn:nbn:de:hbz:464-20120315-103208-1, March 13, 2012.
The collected BibTeX references in a single file are available as: BiBTeX file, XML file, ODT file, DOCX file. These lists were generated using BibTeXCov 2.0!
Ahmed, Azza Hassan Mohamed; Dreibholz, Thomas; Michelinakis, Foivos Ioannis and Čičić, Tarik: ``Open 5G Testbed: A Cyber Range Platform for Security Research´´ (PDF, 798 KiB, 8 pages, 🇬🇧), in Proceedings of the 18th Workshop on Cyber Security Experimentation and Test (CSET) in conjunction with the 41st Annual Computer Security Applications Conference (ACSAC), pp. 579–586, DOI 10.1109/ACSACW69556.2025.00067, Honolulu, Hawaii/U.S.A., December 8, 2025, [BibTeX, XML].
Keywords: 5G Testbed, Cyber Range, Security, Experimentation, Virtualization, Open-Source
Abstract: The fifth generation (5G) of wireless communication offers gigabit-per-second speeds, ultra-low latency, and massive device connectivity. However, the introduction of network function virtualization (NFV), software-defined networking (SDN), network slicing, and mobile edge computing (MEC) has also created a complex security frontier. Addressing these challenges requires continuous and realistic validation of defenses in controlled experimentation environments. In this paper, we present an open-source, low-cost, fully software-based 5G testbed designed as a cyber range platform for security research and education. Built upon the OpenAirInterface (OAI) framework and commercial off-the-shelf hardware, the testbed supports an end-to-end 5G Stand-Alone (SA) deployment with gNodeB, core network, and user equipment (UE). It enables reproducible experimentation that may demonstrate a broad range of security scenarios, including privacy and tracking-based vulnerabilities (e.g., capturing user identifiers) as well as availability attacks such as DoS attacks targeting core network functions.
The paper outlines our reproducible implementation and shares our experiences in building and operating the platform as a cyber range.
URL: https://web-backend.simula.no/sites/default/files/2025-12/CSET2025.pdf
MD5: 0f2e763cc299988acb9c093e429cb994
Mazumdar, Somnath and Dreibholz, Thomas: ``Towards a Privacy Preserving Data Flow Control via Packet Header Marking´´ (PDF, 2009 KiB, 8 pages, 🇬🇧), in Proceedings of the 24th IEEE International Conference on High Performance Computing, Data, and Analytics (HPCC), pp. 1509–1516, DOI 10.1109/HPCC-DSS-SmartCity-DependSys57074.2022.00232, ISBN 979-8-3503-1993-4, Chengdu, Sichuan/People's Republic of China, December 18, 2022, [BibTeX, XML].
Keywords: Cloud, Data, Fog, P4, Packets, Privacy, Routing
Abstract: Computing infrastructure is becoming ubiquitous thanks to the advancement in computing and the network domain. Reliable network communication is essential to offer good quality services, but it is not trivial. There are privacy concerns. Metadata may leak user information even if traffic is encrypted. Some countries have data privacy preserving-related regulations, but end-users cannot control through which path, networks, and hardware their data packets should travel. Even worse, the user cannot declare their privacy preferences. This paper presents an approach to tackle such privacy issues through data privacy-aware routing. The user can specify their preferences for packet routing using marking and filtering. Routing can work according to such specifications. It is implemented by P4, allowing a vendor-independent realisation with standard off-the-shelf hardware and open-source software components. We presented the initial experimental results of a proof-of-concept run on a unified cloud/fog research testbed.
URL: https://web-backend.simula.no/sites/default/files/publications/files/hpcc2022.pdf
MD5: e4736c18f80bee8084c75a587f6c7e0a
Dreibholz, Thomas: ``NetPerfMeter: A Network Performance Metering Tool´´ (, 🇬🇧), in Multipath TCP Blog, September 7, 2015, [BibTeX, XML].
Keywords: Software, NetPerfMeter, Multi-Path Transfer, Multi-Path TCP (MPTCP)
Abstract: A common problem for evaluating multiple transport protocols in a multi-platform environment is to have a test tool that is capable to run in all these environments, and – of course – to support all necessary protocols. Using different evaluation tools is not a good solution, since each tool may introduce its own – and possibly incompatible – parametrisation scheme. In order to overcome this problem, originally for the use case of evaluating the Stream Control Transmission Protocol (SCTP) and compare it to the Transmission Control Protocol (TCP), NetPerfMeter has been designed and developed. This blog article provides an introduction to NetPerfMeter.
MD5: 84d5a41e4357d7cc69c508a44c1d8aa0
Dreibholz, Thomas; Zhou, Xing and Fu, Fa: ``Multi-Path TCP in Real-World Setups – An Evaluation in the NorNet Core Testbed´´ (PDF, 211 KiB, 6 pages, 🇬🇧), in 5th International Workshop on Protocols and Applications with Multi-Homing Support (PAMS), pp. 617–622, DOI 10.1109/WAINA.2015.74, ISBN 978-1-4799-1775-4, Gwangju/South Korea, March 25, 2015, [BibTeX, XML].
Keywords: NorNet, Multi-Path TCP (MPTCP), Multi-Homing, Multi-Path Transport, Evaluation
Abstract: Nowadays, cloud applications are becoming more and more popular. However, in order for such applications to work, they need a stable Internet connectivity. To avoid the Internet access becoming a single point of failure, redundancy by multi-homing – i.e. simultaneous access to multiple Internet service providers (ISP) – is becoming increasingly common as well. Multi-homing leads to the desire to utilise all network attachment points simultaneously, which is e.g. provided by the Multi-Path TCP (MPTCP) extension for TCP. MPTCP is still under development by researchers and standardisation in the IETF. Particularly, it is necessary to evaluate MPTCP under realistic Internet conditions.
NorNet Core is the world's first, large-scale Internet testbed for multi-homed systems and applications. It is therefore a useful platform for evaluating MPTCP. In this paper, we therefore present our NorNet Core extension that adds MPTCP support to the testbed. Particularly, our extension is now available to all users of NorNet Core as well, which significantly reduces the effort of MPTCP researchers to evaluate MPTCP and its improvements. In a proof of concept, we furthermore show the strengths and weaknesses of state-of-the-art MPTCP in NorNet Core, in a configuration covering 29 ISP connections at 14 sites in 5 different countries.
URL: https://web-backend.simula.no/sites/default/files/publications/files/pams2015-mptcp-web.pdf
MD5: 1d87843d61fd55880aa7aa25fba51e19
Dreibholz, Thomas; Adhari, Hakim; Becke, Martin and Rathgeb, Erwin Paul: ``Simulation and Experimental Evaluation of Multipath Congestion Control Strategies´´ (PDF, 403 KiB, 6 pages, 🇬🇧), in Proceedings of the 2nd International Workshop on Protocols and Applications with Multi-Homing Support (PAMS), DOI 10.1109/WAINA.2012.186, ISBN 978-0-7695-4652-0, Fukuoka/Japan, March 29, 2012, [BibTeX, XML].
Keywords: Multipath Transfer, Congestion Control, Performance Analysis, Simulation, Measurement
Abstract: The need for service resilience is leading to a steadily growing number of multi-homed Internet sites. In consequence, this results in a growing demand for utilising multiple Internet accesses simultaneously, in order to improve application payload throughput during normal operation. Multi-path Transport Layer protocol extensions – like Multi-Path TCP (MPTCP) for TCP and Concurrent Multipath Transfer for SCTP (CMT-SCTP) – allow applications to make use of such network topologies.
However, since TCP – which constitutes the basis of most Internet applications – and its congestion control procedures have been designed under the assumption of single-homed sites, fairness issues may arise by the usage of multipath transport. These issues are addressed by advanced congestion control approaches, which have already been examined by simulations. However, real-life network measurements are missing. In this paper, we perform an experimental proof-of-concept evaluation of several multipath congestion control strategies, which are currently under discussion within the IETF in the context of MPTCP as well as CMT-SCTP. Particularly, we validate effects that have been observed in simulations, in order to trigger further discussions on multipath congestion control. Also, our goal is to provide insight into the different approaches to support the ongoing IETF standardisation activities on multipath transport protocols.
MD5: 9f0ed4e466615996b4e65ccb10ec3c7d
Dreibholz, Thomas: ``Evaluation and Optimisation of Multi-Path Transport using the Stream Control Transmission Protocol´´ (PDF, 36779 KiB, 264 pages, 🇬🇧), Habilitation Treatise, University of Duisburg-Essen, Faculty of Economics, Institute for Computer Science and Business Information Systems, URN urn:nbn:de:hbz:464-20120315-103208-1, March 13, 2012, [BibTeX, XML].
Keywords: Stream Control Transmission Protocol (SCTP), Multi-Path Transport, Dissimilar Paths, Fairness, Evaluation, Optimisation
Abstract: The Stream Control Transmission Protocol (SCTP) as defined in RFC 4960 is an advanced Transport Layer protocol that provides support for multi-homing. That is, SCTP endpoints may simultaneously use multiple Network Layer addresses, which allows to connect the endpoints to multiple networks for redundancy purposes. However, for the transfer of user data, only one of the possible paths is currently used at a time. All other paths remain as backup and are only used for retransmissions.
Clearly, the existence of multiple paths has led to the idea of applying load sharing among the paths. An extension to SCTP – denoted as Concurrent Multipath Transfer (CMT) – realises this load sharing functionality. While this approach works well for similar paths, i.e. paths having similar characteristics regarding bandwidths, bit error rates and delays, the use of dissimilar paths does not work that neatly.
In this thesis, the issues of dissimilar paths for CMT-based load sharing will be demonstrated first. The reasons for these issues will be identified and solutions proposed. These solutions will be evaluated in simulations, as well as partially also in a real-world Internet testbed setup, in order to show their effectiveness. In particular, it will be shown that a combination of multiple mechanisms is necessary to make CMT work as expected under a wide range of network and system parameters.
Furthermore, the fairness of CMT-based transport – in concurrency to classic non-CMT flows – will be analysed. The usage of plain CMT leads to an overly aggressive bandwidth occupation on so-called shared bottlenecks. As a countermeasure, the idea of Resource Pooling will be utilised. For this purpose, two new and one adapted congestion control approach – all based on the Resource Pooling principle – will be introduced and examined in similar as well as dissimilar path setups, in order to show how to fairly deploy CMT transport in the Internet.
The results of this work have also been contributed to the ongoing IETF standardisation process of SCTP and its extensions.
URL: https://www.nntb.no/~dreibh/habilitation/Dre2012.pdf
MD5: add34f0b780cb35b7ee1f963ea85e59c
Dreibholz, Thomas; Becke, Martin; Adhari, Hakim and Rathgeb, Erwin Paul: ``Evaluation of A New Multipath Congestion Control Scheme using the NetPerfMeter Tool-Chain´´ (PDF, 360 KiB, 6 pages, 🇬🇧), in Proceedings of the 19th IEEE International Conference on Software, Telecommunications and Computer Networks (SoftCOM), pp. 1–6, ISBN 978-953-290-027-9, Hvar, Dalmacija/Croatia, September 16, 2011, [BibTeX, XML].
Keywords: NetPerfMeter Tool-Chain, Concurrent Multipath Transfer, Congestion Control, Dissimilar Paths, Performance Analysis
Abstract: Multi-homed Internet sites become more and more widespread, due to the rising dispersal of inexpensive Internet access technologies combined with the growing deployment of resilience-critical applications. Concurrent Multipath Transfer (CMT) denotes the Transport Layer approach to utilise multiple network paths simultaneously, in order to improve application payload throughput. Currently, CMT is a quite hot topic in the IETF – in form of the Multipath TCP (MPTCP) and CMT-SCTP protocol extensions for TCP and SCTP. However, an important issue is still not fully solved: multipath congestion control.
In order to support the IETF activities, we have set up a distributed Internet testbed for CMT evaluation. An important tool – which we have developed for multi-protocol Transport Layer performance analysis – is the Open Source
NetPerfMeter tool-chain. It supports the parametrisation and processing of measurement runs as well as results collection, post-processing and plotting. However, its key feature is to support multiple Transport Layer protocols, which makes a quantitative comparison of different protocols – including state-of-the-art features like CMT – possible. In this paper, we first introduce
NetPerfMeter and then show a proof-of-concept performance evaluation of CMT congestion controls which are currently discussed in the IETF standardisation process of CMT-SCTP.
MD5: 23b808c6caa72f0cfb5213d8b6cf7b31
Dreibholz, Thomas; Becke, Martin; Pulinthanath, Jobin and Rathgeb, Erwin Paul: ``Implementation and Evaluation of Concurrent Multipath Transfer for SCTP in the INET Framework´´ (PDF, 587 KiB, 8 pages, 🇬🇧), in Proceedings of the 3rd ACM/ICST International Workshop on OMNeT++, DOI 10.4108/ICST.SIMUTOOLS2010.8673, ISBN 978-963-9799-87-5, Torremolinos, Málaga/Spain, March 19, 2010, [BibTeX, XML].
Keywords: INET Framework, SCTP, Concurrent Multipath Transfer, Model, Evaluation
Abstract: The steadily growing importance of resilience-critical Internet applications leads to a rising number of multi-homed sites and systems. But since the protocols of the classical Internet – particularly TCP – assume a single access path only, the number of programs supporting multiple network paths is still small. The Stream Control Transport Protocol (SCTP), which is an advanced general-purpose transport protocol and the possible successor of TCP, brings the support of multi-homing into the applications.
For technical reasons, SCTP uses one network path for data transmission and utilizes the other paths for backup only. An extension to support the load balancing of user data onto multiple paths in order to increase the payload throughput is Concurrent Multipath Transfer for SCTP, denoted as CMT-SCTP. In this paper, we describe our CMT-SCTP extension for the SCTP model provided by the INET framework. By using proof-of-concept simulations, we furthermore demonstrate its usability and configuration parameters.
MD5: 910129c4f8742f16aa603347276bcf90
Dreibholz, Thomas; Zhou, Xing and Rathgeb, Erwin Paul: ``SimProcTC – The Design and Realization of a Powerful Tool-Chain for OMNeT++ Simulations´´ (PDF, 552 KiB, 8 pages, 🇬🇧), in Proceedings of the 2nd ACM/ICST International Workshop on OMNeT++, pp. 1–8, DOI 10.4108/ICST.SIMUTOOLS2009.5517, ISBN 978-963-9799-45-5, Rome/Italy, March 6, 2009, [BibTeX, XML].
Keywords: SimProcTC, Simulation, Parametrization, Run Distribution, Results Visualization
Abstract: In this paper, we introduce our Open Source simulation tool-chain for OMNeT++ simulations: SimProcTC. This model-independent tool-chain has been designed to perform the common and frequently recurring tasks of simulation work – which are the parametrization of runs, the distributed run processing and the results visualization – in an efficient and easy to use manner. It is already successfully deployed for several OMNeT++-based research projects.
MD5: 1ec4aec2824e6f4d11f1e1af9a8d3991
Dreibholz, Thomas and Rathgeb, Erwin Paul: ``A Powerful Tool-Chain for Setup, Distributed Processing, Analysis and Debugging of OMNeT++ Simulations´´ (PDF, 558 KiB, 8 pages, 🇬🇧), in Proceedings of the 1st ACM/ICST International Workshop on OMNeT++, DOI 10.4108/ICST.SIMUTOOLS2008.2990, ISBN 978-963-9799-20-2, Marseille, Bouches-du-Rhône/France, March 7, 2008, [BibTeX, XML].
Keywords: SimProcTC, Simulation Model, Parametrization, Simulation Run Distribution, Plotting, Analysis
Abstract: In this paper, we introduce our Open Source tool-chain providing the parametrization, distributed execution, results post-processing and debugging for
OMNeT++-based simulations. While the initial motivation of these tools has been the support of our simulation model of the Reliable Server Pooling (RSerPool) framework, it has been particularly designed with model-independence in mind. That is, it can be easily adapted to other simulation models and therefore may be useful for other users of
OMNeT++-based simulation models as well.
MD5: 23f563d708ab1eb3f55d6dd21ef4eee4